

A persuasion image tells a shopper your product is better. A comparison table lets them check it themselves, row by row. Nielsen Norman Group's own UX research calls this out directly: comparison is one of the most critical activities users perform on the web, and it's often a necessary step before someone buys, signs up, or requests a quote. The table format exists because people trust a structured comparison more than an adjective.
Ad Studio's generate_image_preset_agent ships a comparison-table preset that builds exactly this structure into one generated image: a clean grid of real facts, a generic side's crosses against the brand's own checkmarks.
Why a table, and why now
Most of this preset mini-series has demonstrated single-claim persuasion mechanisms: one review quote (social-proof), one cited number (statistics-data), one frustration resolved (problem-solution), one point of difference (comparison-vs). The comparison-table preset is different in kind, not just in topic. It doesn't argue one point. It lays out several attributes at once and lets the pattern of checkmarks do the arguing.
NN/g's research on comparison tables distinguishes two modes of decision-making: noncompensatory, where a shopper filters out everything over a price cutoff without weighing anything else, and compensatory, where a shopper is choosing among a small set of options and genuinely weighs each one's pros and cons against the others. Their finding is specific: compensatory decision-making is best served by comparison tables, because they let a shopper see and compare multiple attributes at a glance instead of digging through separate spec sheets or product pages. That's the exact moment a static comparison-table ad is built to shortcut: the scroll where someone is comparing a handful of real alternatives and hasn't decided yet.
NN/g also flags when a table is the wrong tool. Comparison tables don't help when items aren't mutually exclusive, when they're too simple to have meaningful attributes (a coffee mug doesn't need five rows of comparison), when they're cheap enough that a shopper won't bother weighing options, or when they're too unique to compare on shared criteria. A table ad for a product that fails all four tests reads as padding, not proof. This preset earns its keep on considered-purchase categories: software tiers, subscription plans, appliances, anything with real, nameable attributes a shopper actually cares about.
What the comparison-table preset actually does
The preset renders one static image structured as a grid: columns for the two sides being compared, rows for each attribute, checkmarks and crosses (or short factual values) filling the cells. One column is your product. The other is a generic alternative, "the typical plan," "a basic version," never a named real competitor, the same discipline this mini-series' comparison-vs preset already established and the one line that keeps the format legally and reputationally simple.

The sibling presets in this family each borrow a different lever. The social-proof preset borrows someone else's words. The statistics-data preset borrows a cited number. The comparison-vs preset borrows a single point of contrast. The feature-infographic preset borrows callouts pointing at real physical features. The comparison-table preset borrows structure itself: it hands the shopper the same compensatory-decision tool a UX researcher would recommend for a considered purchase, pre-filled in your favor using attributes a buyer can actually verify.
The rule that matters more here than almost anywhere else
Every cell in the table has to be checkable. The FTC's Statement of Policy Regarding Comparative Advertising treats a side-by-side comparison exactly like any other advertising claim: the question is whether it has a tendency to be false or deceptive, evaluated row by row, not whether the format is flashy. A single fabricated checkmark, a crossed-out attribute the generic alternative actually has, a row that doesn't correspond to anything real about either side, turns one visual into a substantiation problem across every cell in the grid, not just the wrong one.
That's a sharper bar than a single-claim persuasion image has to clear, because a table makes several claims at once instead of one. Brief this preset with a short, literal list: the exact attributes being compared, and the true value for each side. Don't let the model invent a fourth attribute to round out the grid, and don't let it soften an attribute the generic side genuinely has just because it makes the table look cleaner.
Worked example: a literal spec grid, not a vibe
Start with a product photo and a short list of real, checkable attributes, the same kind of facts that would appear on an actual spec sheet or pricing page. The brief for the preset:
Preset: comparison-table
Product: [product photo URL or productId]
Attributes (3-4 max): [literal, checkable items, e.g. "Free shipping", "24-hour support", "Lifetime warranty", written exactly as true for each side]
Generic alternative label: ["Typical plan," "Basic version," or similar, never a named real brand]
Style direction: clean grid layout, checkmark for yes, cross for no, legible row labels, no invented attribute beyond what's listed
Avoid: any real competitor name or logo in either column, a crossed-out item the generic side actually has, garbled table text
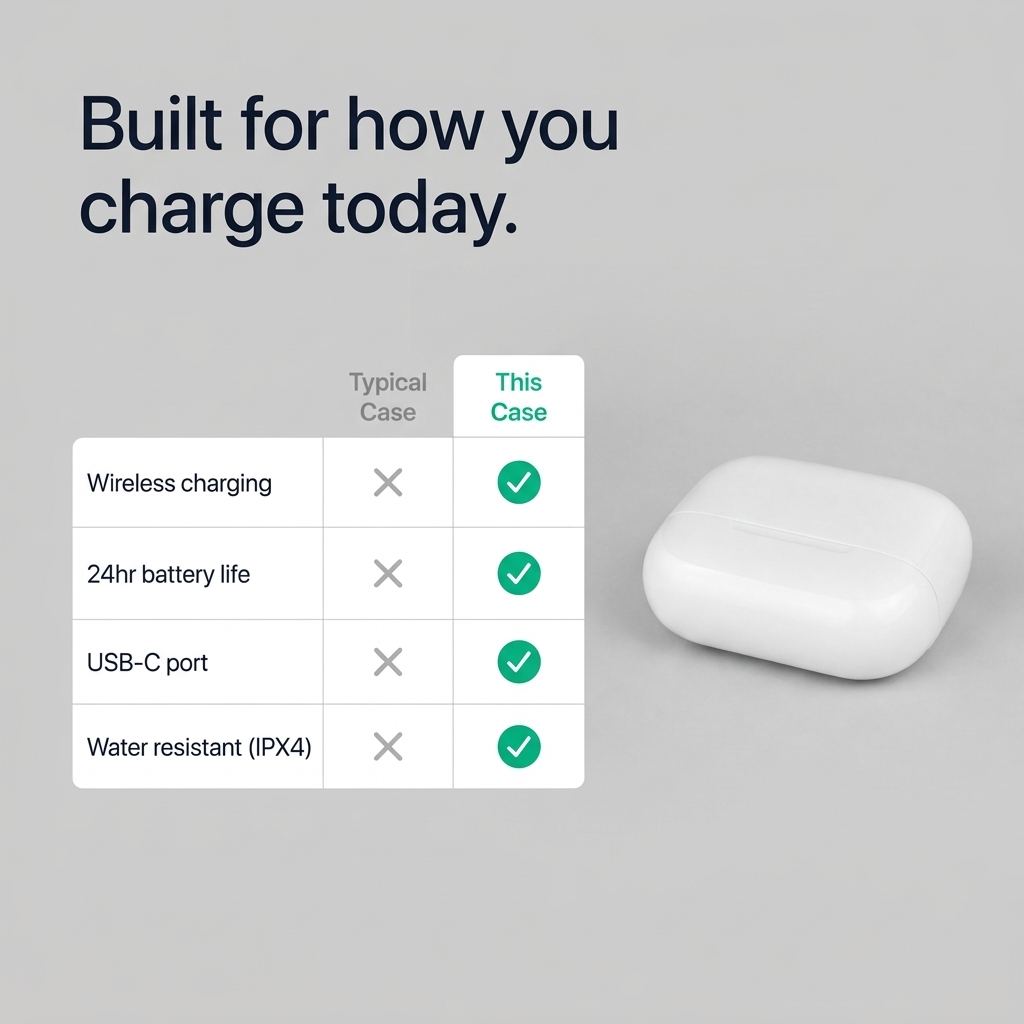
This is a real generate_image_preset_agent render, preset comparison-table, fired against a demo product photo with the exact prompt above. The output laid out the named attributes as a two-column grid with the brand side checked across every row and the generic side crossed where specified, legible and accurate to the brief before publishing.
FAQ
How many attributes should go in one table? Three to four. NN/g's own guidance on comparison tables caps a workable set at around five items before a layout gets cluttered and hard to scan at a glance, and that's for a full interactive table with room to breathe, a static ad image has even less room. Pick the attributes that actually move a buying decision, not every spec you can think of.
Does the preset verify the attributes are true? No. Same discipline as every preset in this family: the model only composes what it's given. Confirming each attribute is accurate for both sides, including the generic alternative, is the advertiser's job before the prompt is written.
Can the generic side be a real competitor? Don't. Naming a real brand turns this into a comparative-advertising substantiation question under FTC policy for every single row in the grid, not just one claim. A generic label keeps the format legally simple while losing none of its persuasive structure.
How is this different from the comparison-vs preset? Comparison-vs makes one point of difference the entire visual. Comparison-table lays out several attributes side by side in a literal grid. Use comparison-vs for a single sharp differentiator, comparison-table when a buyer is genuinely weighing multiple real factors before deciding, the exact situation NN/g's research says a table serves best.
What products are a bad fit for this preset? Anything too simple or too cheap to have meaningful attributes a shopper would actually compare, NN/g's own examples are a coffee mug and a roll of paper towels, and anything so unique there's no shared basis for comparison at all. Save the format for considered purchases: software tiers, subscription plans, appliances, anything with real spec differences.
Try it on Coinis
Pull three or four real, checkable facts about your product, put them against a generic alternative, never a named real brand, and let the grid do what a UX researcher would tell you a table does best: hand a comparing shopper the exact structure they're already looking for.
Start building comparison creative on Coinis
Sources
- Moran, Kate, and Taylor Dykes, "Comparison Tables for Products, Services, and Features," Nielsen Norman Group, February 9, 2024: https://www.nngroup.com/articles/comparison-tables/
- Federal Trade Commission, "Statement of Policy Regarding Comparative Advertising": https://www.ftc.gov/legal-library/browse/statement-policy-regarding-comparative-advertising
- Federal Trade Commission, 16 CFR 14.15, "In regard to comparative advertising": https://www.ecfr.gov/current/title-16/section-14.15

Isidora Matovic
Author
Social media enthusiast and a full time researcher. She takes digital presence very seriously and that is why you are always in touch in what is going on with us! Follow us for more posts like this.